Stop Covering Your Charts in Lagging Indicators. Read Raw Market Psychology Instead.
In the 1700s, a legendary Japanese rice trader named Munehisa Homma realized a fundamental truth: Markets aren’t just driven by supply and demand—they are heavily driven by human emotion.
Candlesticks are not just arbitrary shapes; they are a time-tested blueprint of market sentiment.
By: Coach Jem

The Functionality (Reading Wick & Body Language)
How to Interpret Momentum, Compression, and Rejection
To read a chart effectively, you must understand the functional message behind the candle's structure rather than just looking at shapes.
Wide Bodies = Conviction: A wide, solid body with tiny wicks means the dominant side controlled the asset from start to finish. Momentum is strong and aggressive.
Small Bodies = Compression: A tiny body indicates a standstill. Volume may be low, or buyers and sellers are perfectly matched, causing price to compress.
Long Wicks = Rejection: A long upper or lower wick indicates that one side pushed the price to an extreme, but the opposing side aggressively stepped in and forced the price back before the session closed. Wicks represent a sudden, real-time shift in control.
The The Origin & Anatomy (The Foundation of the Chart)
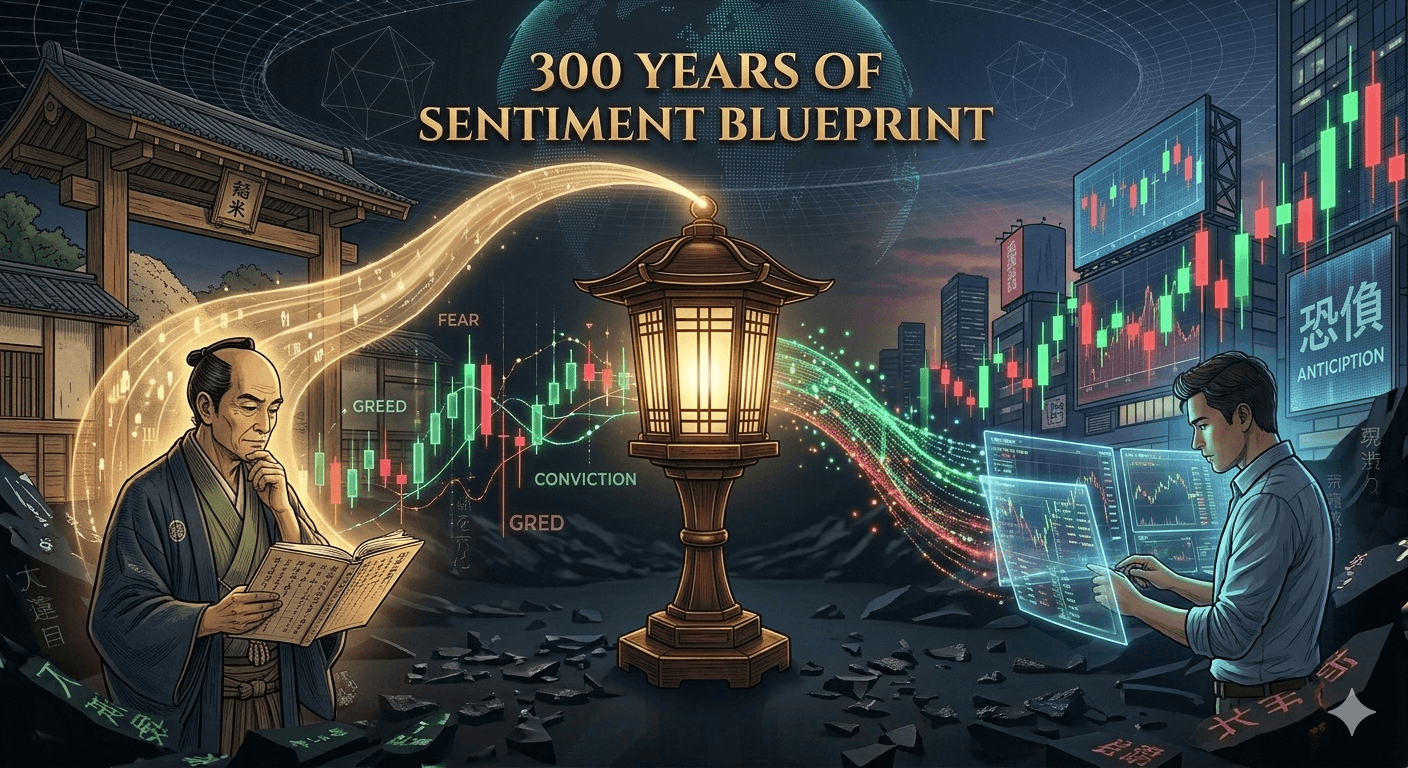
The History and Mechanics of Japanese Candlesticks: Mapping 300 Years of Market Psychology
In the 1700s, a legendary Japanese rice trader named Munehisa Homma realized a fundamental truth that governs modern financial markets: An asset's price isn't just dictated by physical supply and demand—it is heavily driven by human emotion.
Before Homma’s era, merchants tracked markets purely through a fundamental lens, like seasonal harvests or current inventory. But Homma noticed prices fluctuated wildly even when physical supply remained completely unchanged. He realized the market doesn't trade cold, hard facts; it trades human perception—the constant tug-of-war between fear, greed, and anticipation.
To track this invisible psychological battlefield, he created a visual charting method to map merchant conviction in real-time on the Dojima Rice Exchange. Candlesticks are not just arbitrary shapes; they are a 300-year-old, time-tested blueprint of market sentiment.
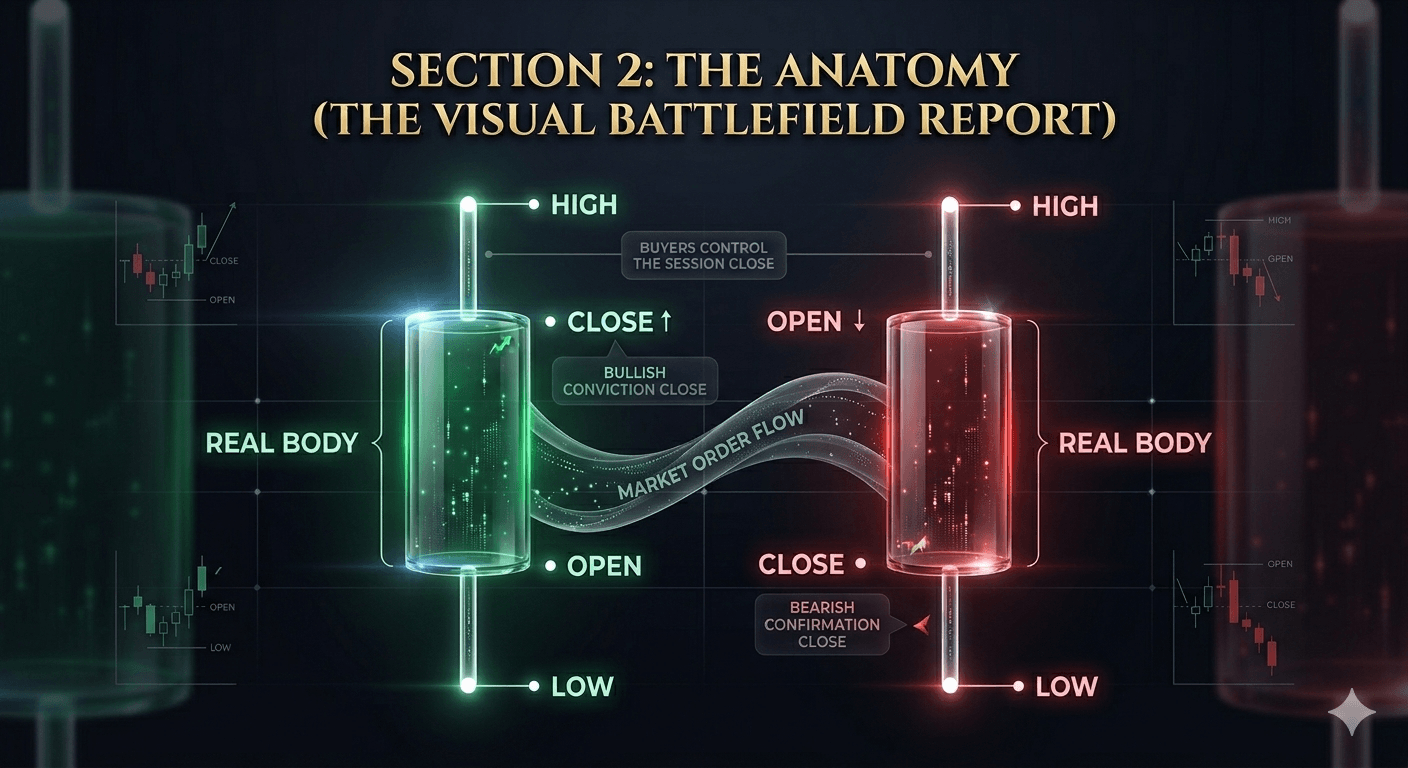
Centuries later, while computer screens have replaced paper ledgers, the underlying human psychology remains identical. The panic selling or speculative greed that drives modern digital assets and commodities triggers the exact same human survival mechanisms today as it did centuries ago. Every single candlestick prints a visual summary of this unyielding battle between Buyers (Bulls) and Sellers (Bears) over a specific timeframe using four critical data points:
The Real Body (The Conviction Line): The solid block showing the distance between the opening and closing price. A heavy, solid body represents undeniable buying or selling conviction, revealing who possessed the staying power to hold their ground until the final second of the session.
The Wicks (The Extremes of Fear & Greed): The thin lines mapping the extreme high and low prices reached during the session. A long upper wick means buyers let greed push prices too high, only to be aggressively crushed by the fear or profit-taking of sellers before the close.
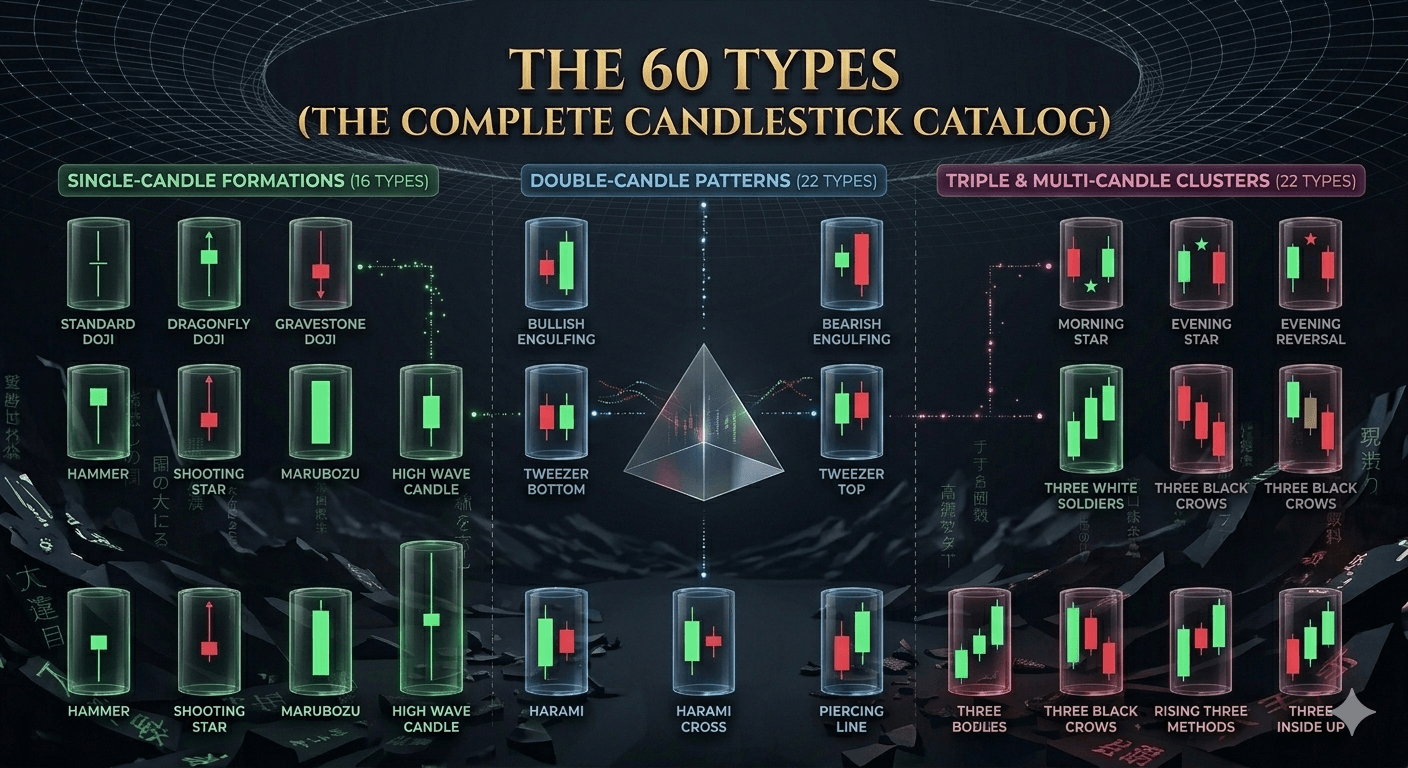
The 60 Types (The Complete Candlestick Catalog)
The market naturally organizes its psychological battles into 60 distinct candlestick types and patterns. These variations are divided into single, double, and triple-candle formations that signal who is winning the market tug-of-war:
Single-Candle Formations (16 Types): Individual candles showing immediate, localized momentum or rejection within a single session. Includes: Marubozu variants, Standard/Dragonfly/Gravestone Dojis, Hammers, Inverted Hammers, Shooting Stars, Hanging Men, Spinning Tops, and High Wave candles.
Double-Candle Patterns (22 Types): Combinations showing how the current session reacts directly to the previous session, exposing sudden shifts in supply and demand. Includes: Engulfing, Harami, Harami Cross, Piercing Line, Dark Cloud Cover, Tweezer Tops/Bottoms, Kickers, Separation, and Meeting Lines.
Triple & Multi-Candle Clusters (22 Types): Multi-session combinations offering the highest psychological confirmation of macro structural reversals or strong trend continuations. Includes: Morning/Evening Stars, Three White Soldiers/Three Black Crows, Three Inside/Outside setups, and Rising/Falling Three Methods.
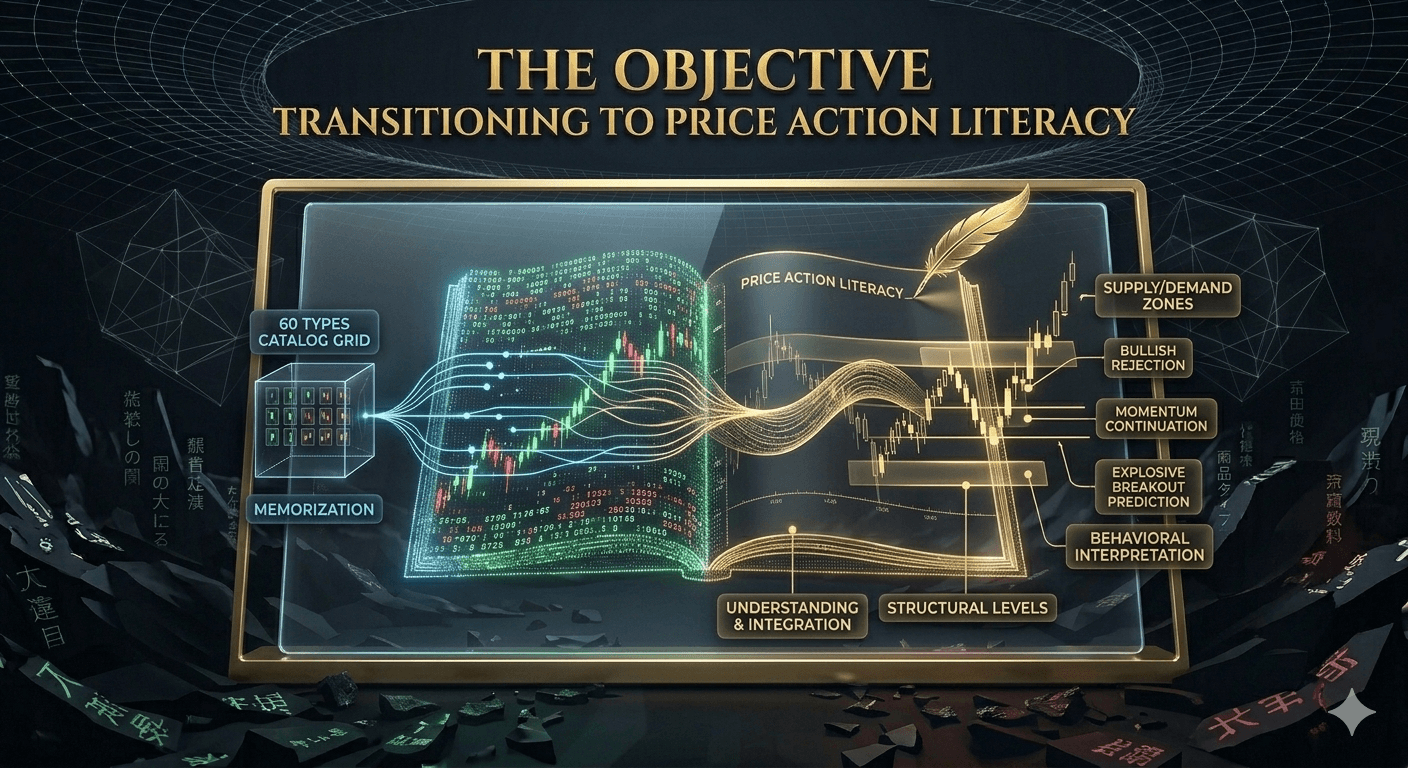
The Objective (Transitioning to Price Action Literacy)
Reading the Chart as a Living Narrative
Indicators calculate past math, but these 60 candlestick variations reveal current human behavior. When you look past individual shapes and begin connecting them, the chart stops looking like random noise and begins reading like a sentence.
By understanding the history, anatomy, and functionality of these patterns, you transition from reacting to lagging data to reading raw price action as it develops in real-time. This foundational literacy allows you to map structural levels, identify supply and demand zones, and understand the market's next logical step with objective clarity.